Data Visualization in PostgreSQL With Apache Superset

Data visualization transforms data into graphical representations such as charts and graphs, making it easier to understand complex information quickly. This helps analysts and stakeholders to identify trends, outliers, and patterns, leading to informed decisions and insights.
For data visualization with PostgreSQL, both paid and open-source tools are available. In this blog post, we quickly introduce some of them and then show you how to visualize data using Apache Superset and PostgreSQL.
> How to Migrate Your Data to Timescale (3 Ways)
> Building Python Apps With PostgreSQL and psycopg3
> Bonus: Psycopg2 vs Psycopg3 Performance Benchmark
Data Visualization Tools for PostgreSQL
Open-source options
- Metabase: With a simple interface, it allows non-technical users to explore and query data directly, making it ideal for basic data analysis.
- Grafana: This data visualization tool focuses on visualizing and monitoring time-series data (e.g., server logs and infrastructure metrics). It offers advanced visualizations, integrations, and plugins but is not designed for traditional BI tasks like ad-hoc querying.
- Apache Superset: It provides comparable features to paid tools like Tableau and Power BI, and supports data exploration, visualizations, and dashboards. This tool offers high customization with SQL editing and user-defined metrics (built on Python).
Paid options
- QlikView: This is a powerful engine that excels at handling large datasets and complex analytics, using in-memory processing for speed.
- Power BI: With a user-friendly interface, it seamlessly integrates with Microsoft products and connects to various data sources for easy analysis.
- Tableau: This data visualization tool helps you create stunning and interactive dashboards that are perfect for presenting data insights clearly.
Paid tools have wider feature sets, better scalability, and more support but require a license, which can be costly. Open-source tools are free to use and modify but may require technical expertise and have limitations for large deployments.
For the purposes of this article, we're choosing Apache Superset for visualizing data inside PostgreSQL because it is an open-source, Python-based, and scalable platform with extensive visualization features. It includes a user-friendly interface and an SQL editor, making it an excellent tool for both technical and non-technical users. To access the dataset, please visit the Postgres-Superset-Example GitHub repo.
Apache Superset
Superset is a fast and lightweight open-source BI platform that makes it easy for users to explore data, using either a no-code visualization builder with drag-and-drop support or SQL IDE. Some key points include:
- Backed by the Apache Software Foundation and supported by Airbnb
- Supports 40+ visualizations from simple line charts to highly detailed geospatial charts
- Able to cache data for dashboard visualizations
- Admin panel available with very detailed settings, including users and roles privileges
- Able to access many SQL and NoSQL databases
- Easy and friendly user interface
Superset is designed to handle datasets of any size since it operates as a thin layer on top of your databases, which manage all the data processing. The platform's performance is more dependent on user activity and the number of users rather than the data size. A setup with 8 GB RAM and 2vCPUs is sufficient for a moderate user base.
Install Apache Superset
Install the basic libraries:
sudo apt-get install build-essential libssl-dev libffi-dev python3-dev python3-pip libsasl2-dev libldap2-dev python3.8-venv
We are going to use a virtual environment for the Superset Installation to avoid conflict with other Python versions.
pip install virtualenv
You can create and activate a virtual environment using:
python3 -m venv venv
. venv/bin/activate
Once the Python virtual environment is activated, any Python packages installed or removed stay within that environment and do not affect the local Python setup. To leave the environment, you can run the following command:
deactivate
Upgrade the pip version inside the virtual environment so you don't get any dependency errors:
pip install --upgrade pip
Start by installing apache-superset and other supporting libraries:
pip install apache-superset

pip install marshmallow

pip install Pillow

pip install psycopg2
Set FLASK_APP and SUPERSET_SECRET_KEY variables. Flask is a lightweight web framework for Python and is used for the Apache Superset web server.
export FLASK_APP=superset
export SUPERSET_SECRET_KEY="mysecretkey"
Create an admin user to access the Superset dashboard (use admin as username to be able to load the examples).
superset fab create-admin
Then, you need to initialize the database:
superset db upgrade
Load some dummy data to play with:
superset load_examples →(Optional)
Create default roles and permissions:
superset init
After this step, It's time to initialize the web server. For development use, start Superset with:
superset run -p 8500 -h 0.0.0.0 --with-threads --reload --debugger
-p = port
-h = Binding host
Note: For production use, configure a web server like Gunicorn, Nginx, or Apache. Follow the guidelines on running Superset on a WSGI HTTP Server.
Access the Superset dashboard with admin credentials:
http://<PUBLICIP>:<PORT>
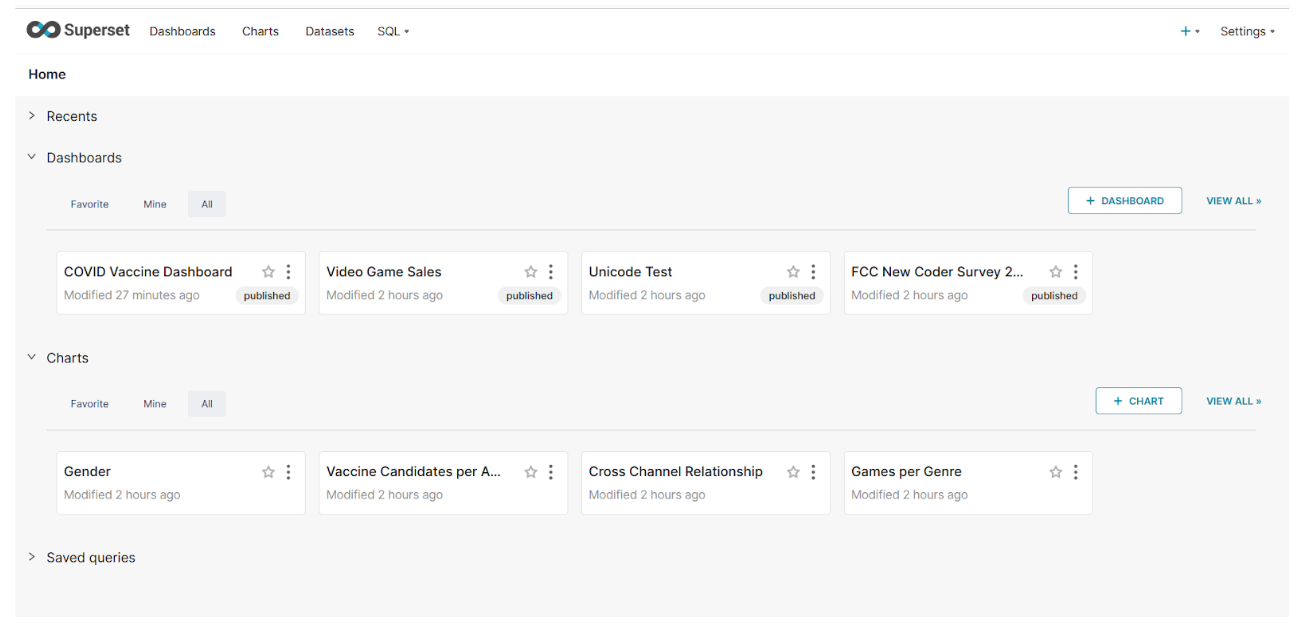
Make sure the port is open and that you can access the web server. Once logged in, you can see the following homepage:
Create PostgreSQL Data Source
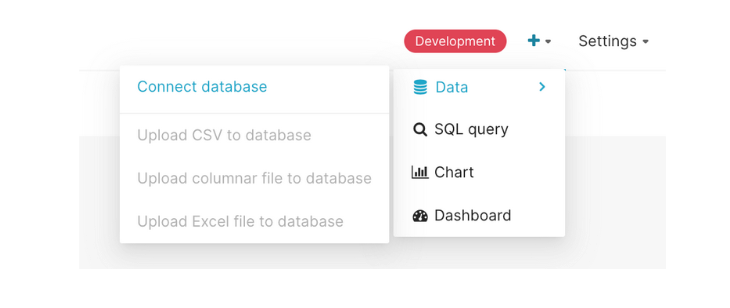
Select the + button on the top right and select Data → Connect Database.
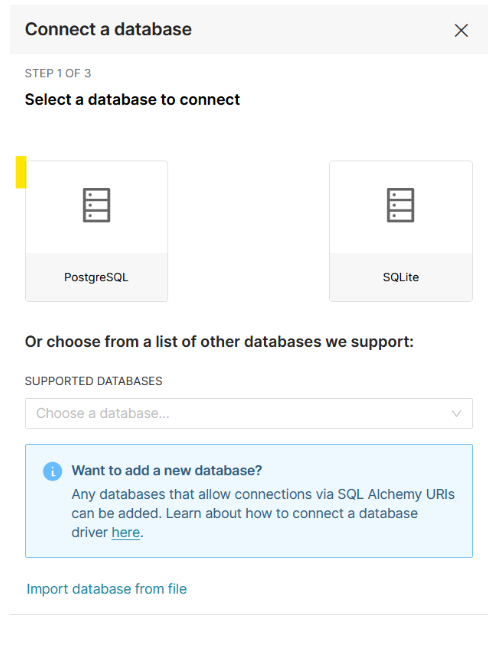
Select PostgreSQL as the database.
Provide credentials for your database.
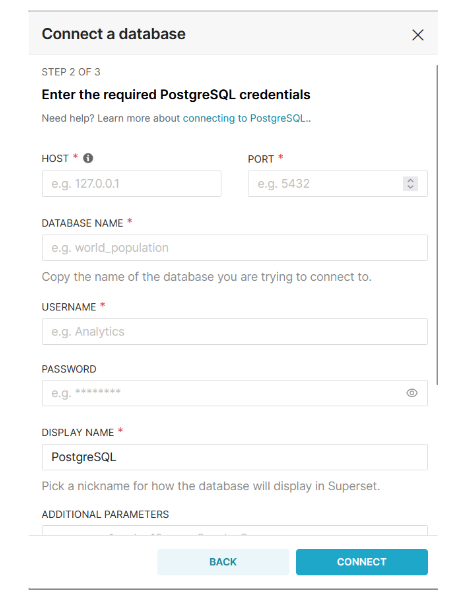
After a successful connection, click the FINISH option.
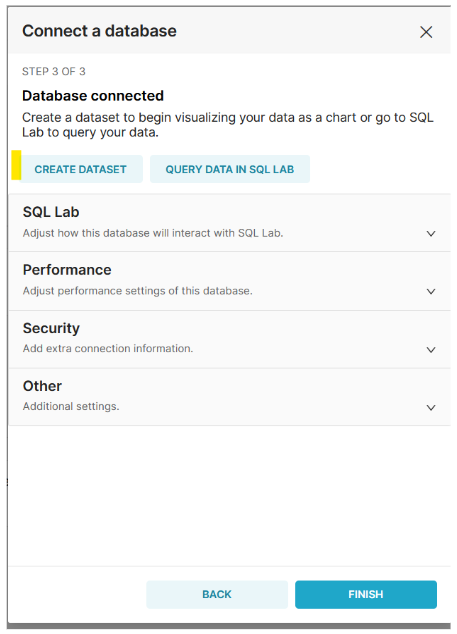
Create Dataset
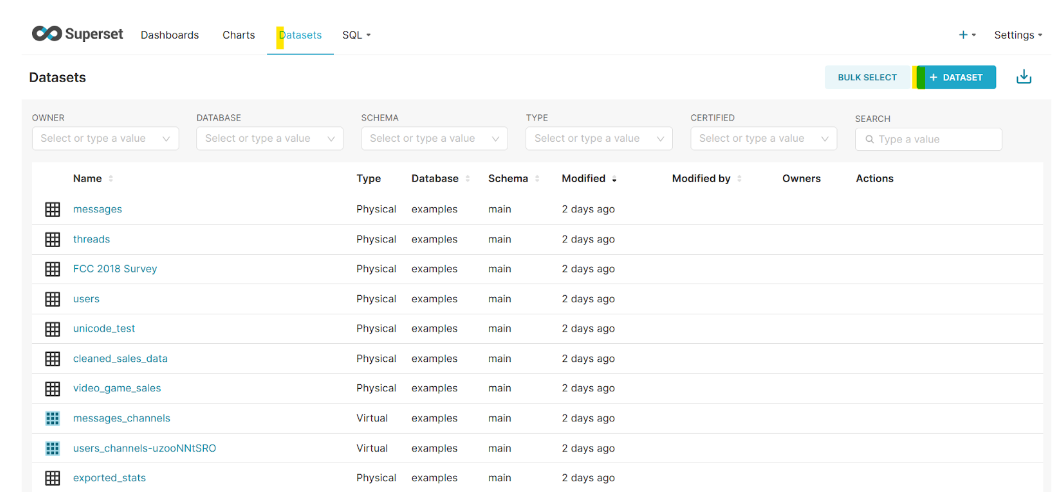
After login, it will take you to this home screen where you can create dashboards, charts and datasets. The first step is to create a dataset where we provide a table or view for visualization.
Click on the + Dataset button to create a dataset.
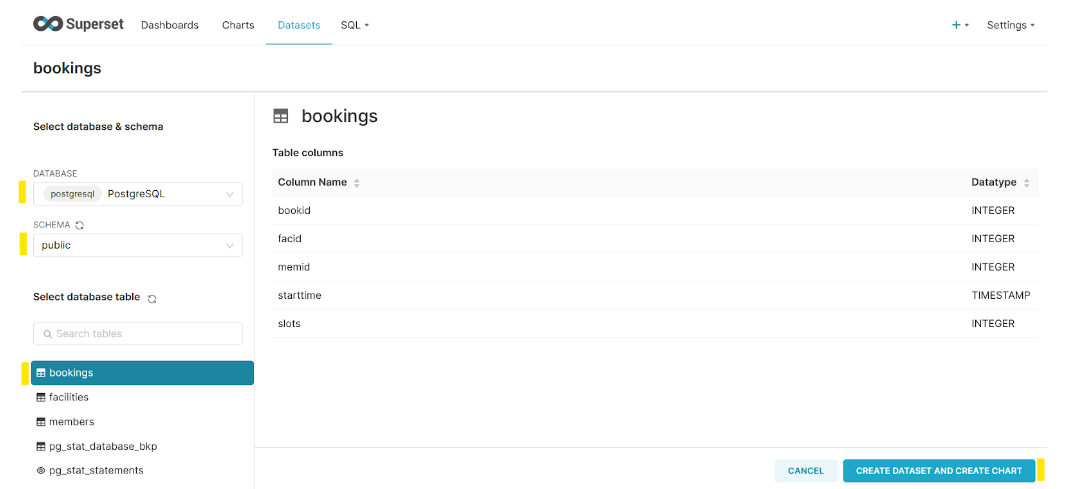
It will take you to the following screen, where you can select objects for visualization. We are using a booking table for visualization. After selection, select the Create Dataset and Create Chart button.
Create Visualization
Using Superset Explorer UI
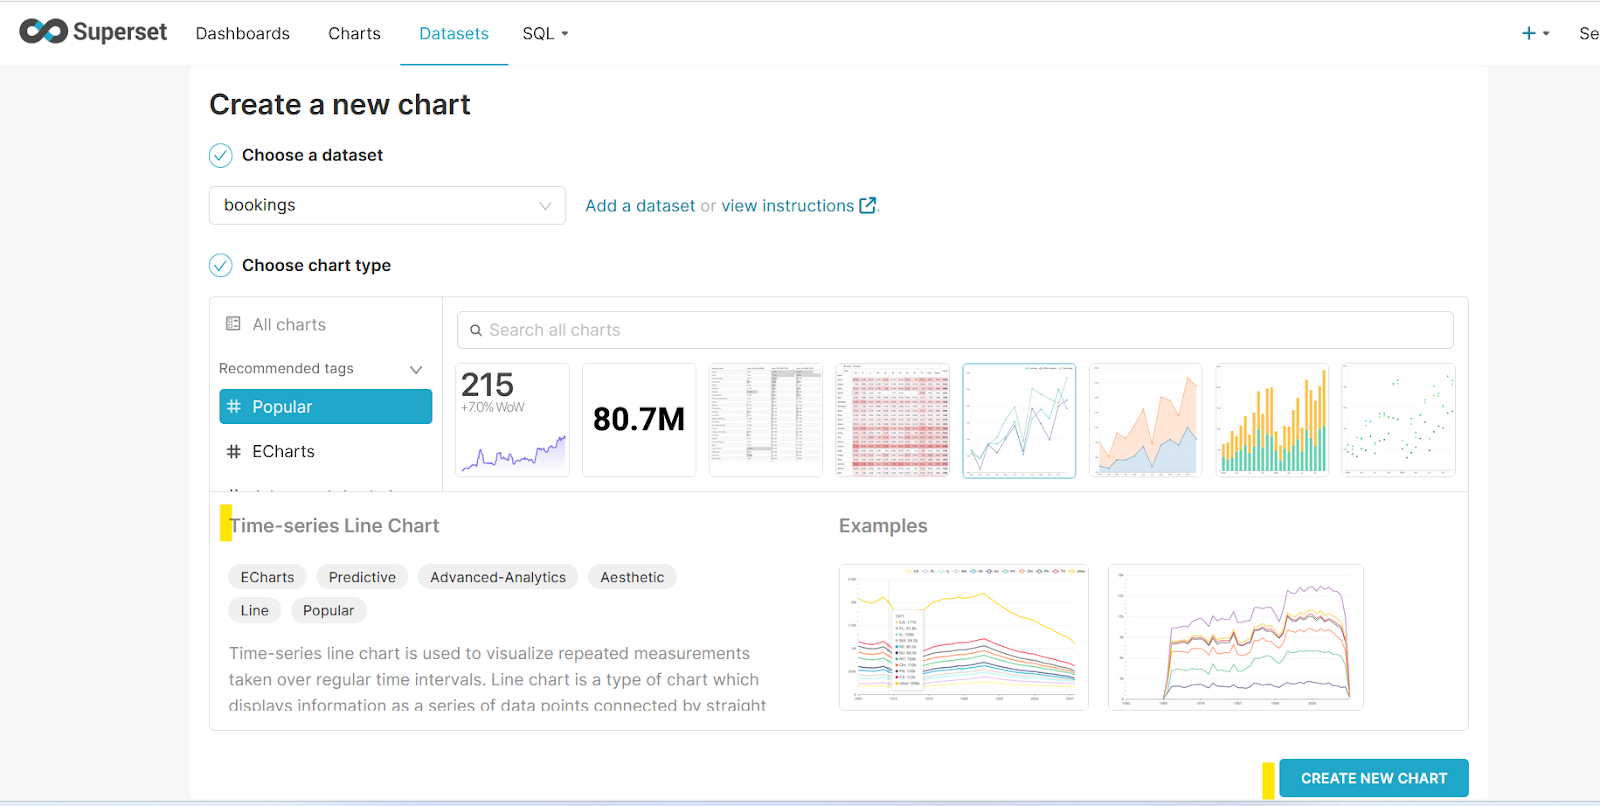
Now, you can select any chart you want as per data points. We are going to select a Time-series Line Chart as per our requirement. Select the Create New Chart button.
At this step, we can now slice and dice our bookings table.
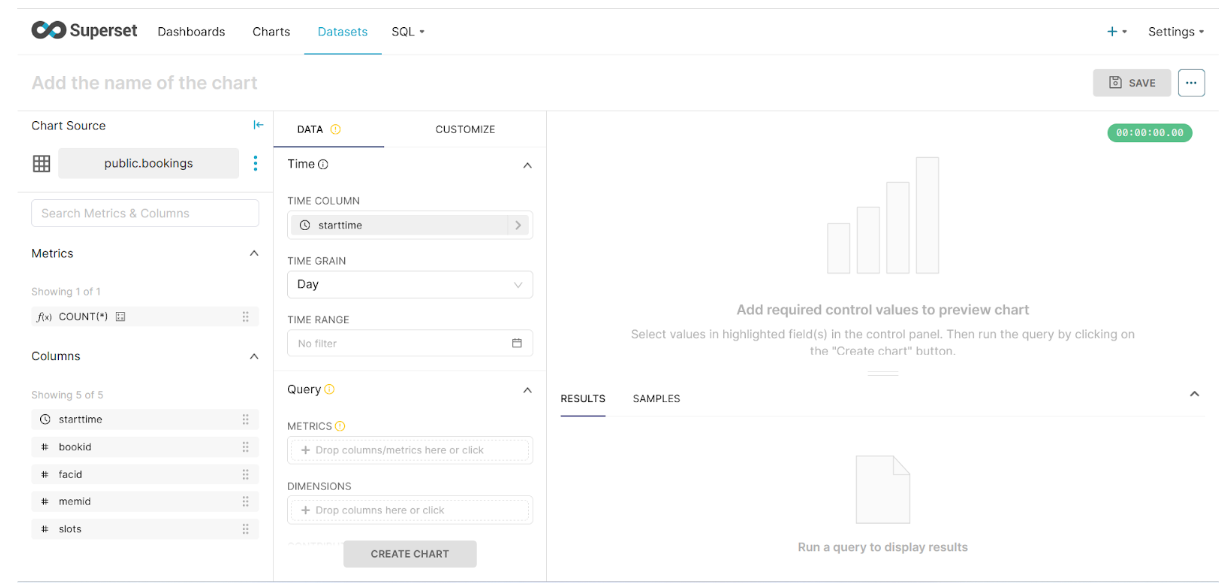
Our requirement is to get Total bookings on a monthly basis. The query would be like this:
select date_trunc('month', starttime) as month, count(*)
    from bookings
    group by month;
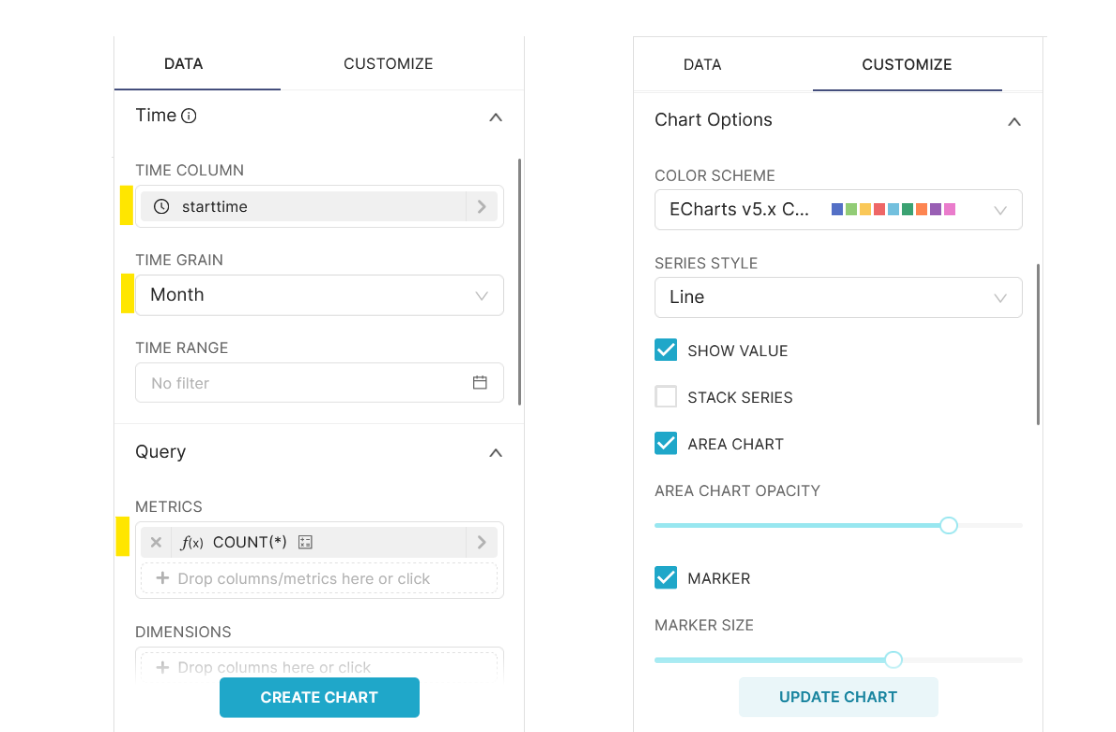
For this, we can set the following parameters on Superset:
- The
timecolumn will bestarttimeand we can set thetimegrainto month. - The metrics fields consist of columns to display. Here we can provide an aggregated column which is
COUNT(*). - For the visualization option, select the Customize tab.
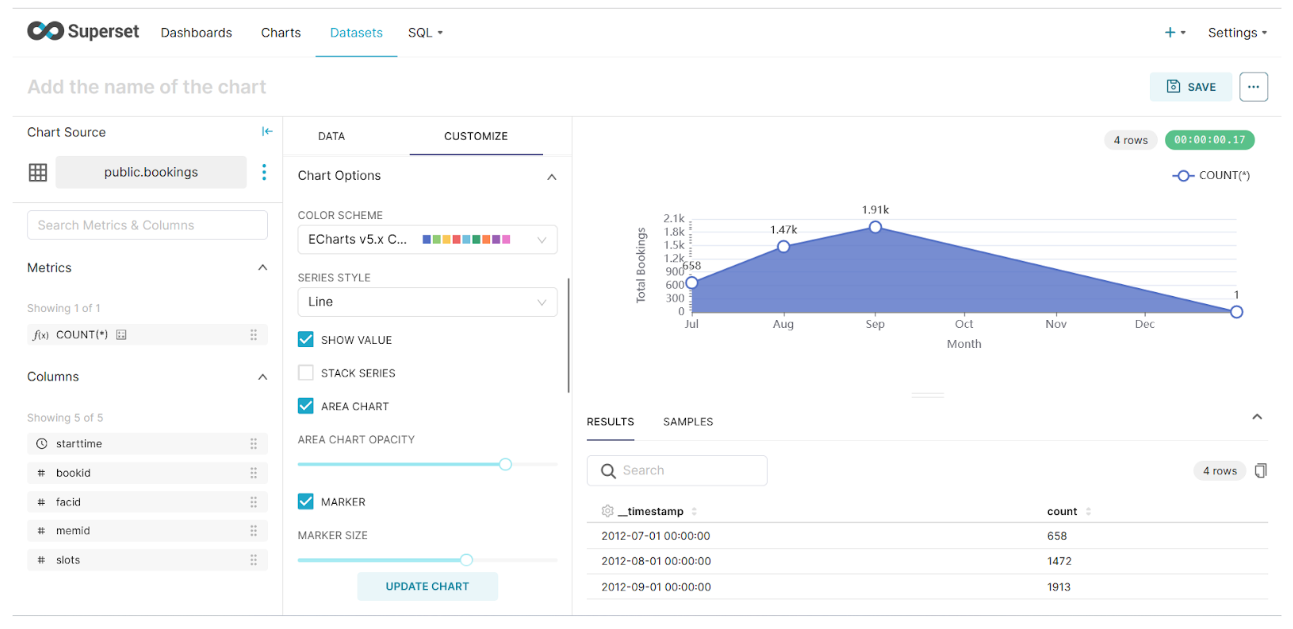
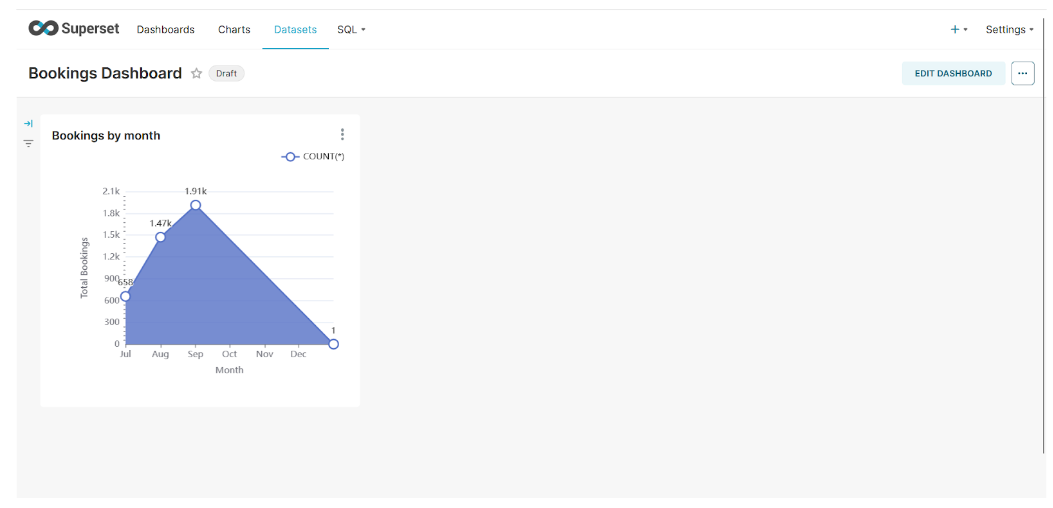
Once you select Create/Update Chart, it will run the query on PostgreSQL and visualize the final results like this.
To save this chart, click on the Save button, provide the chart name, and Create a new dashboard.
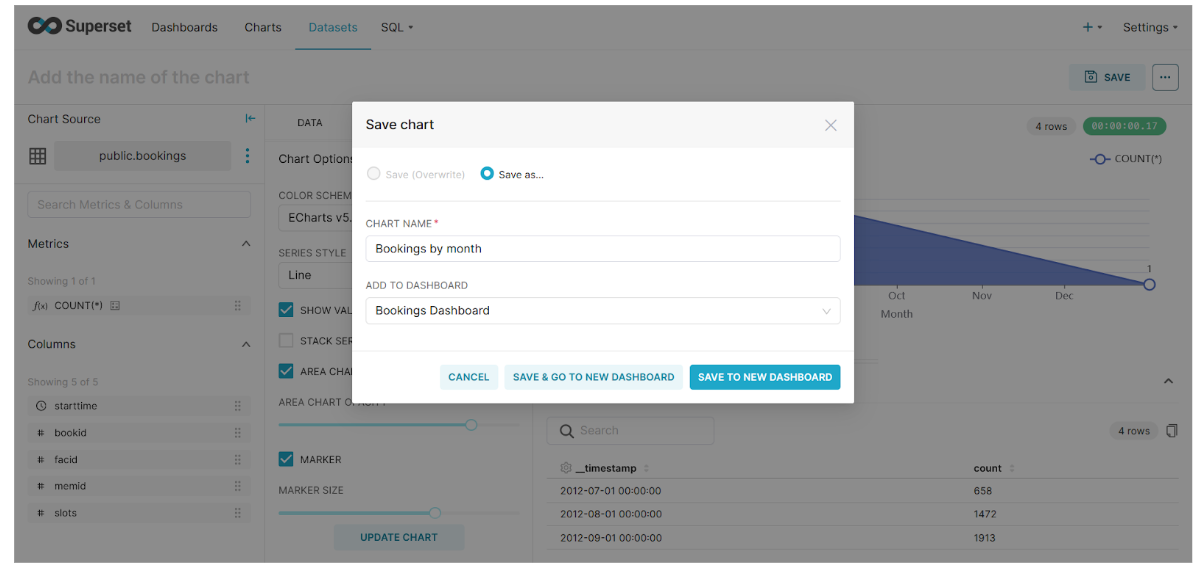
Click on the Save & Go To New Dashboard button.
Using SQL Query
You can also use SQL queries to create dashboards:
Click on SQL → SQL LAB.

Make sure to select the correct database and schema.
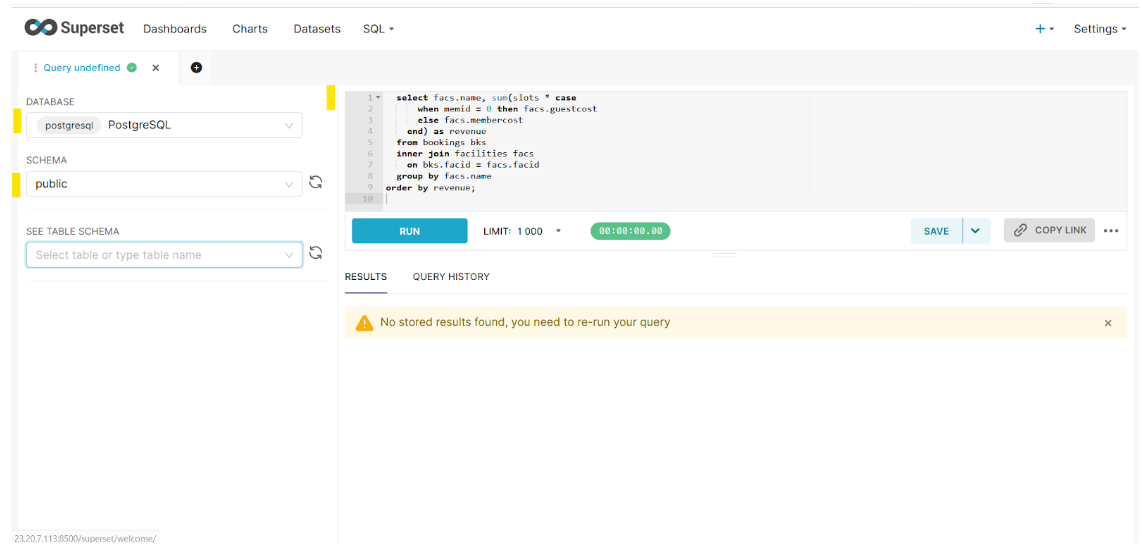
Here you can run the query directly. Once this query is executed, it provides the option to Create Chart.
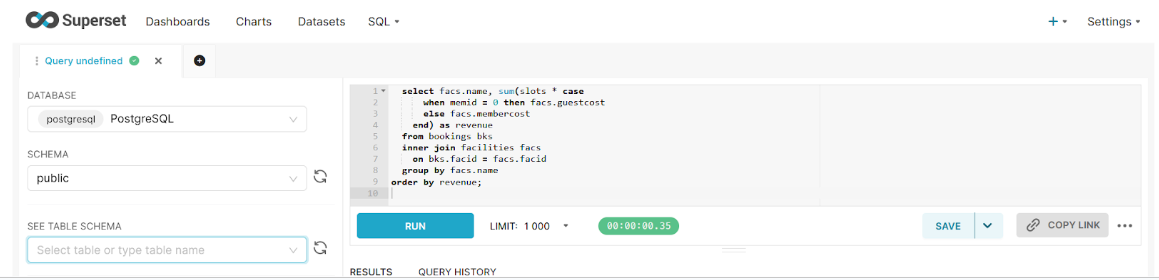
Select Create Chart to visualize the final results.
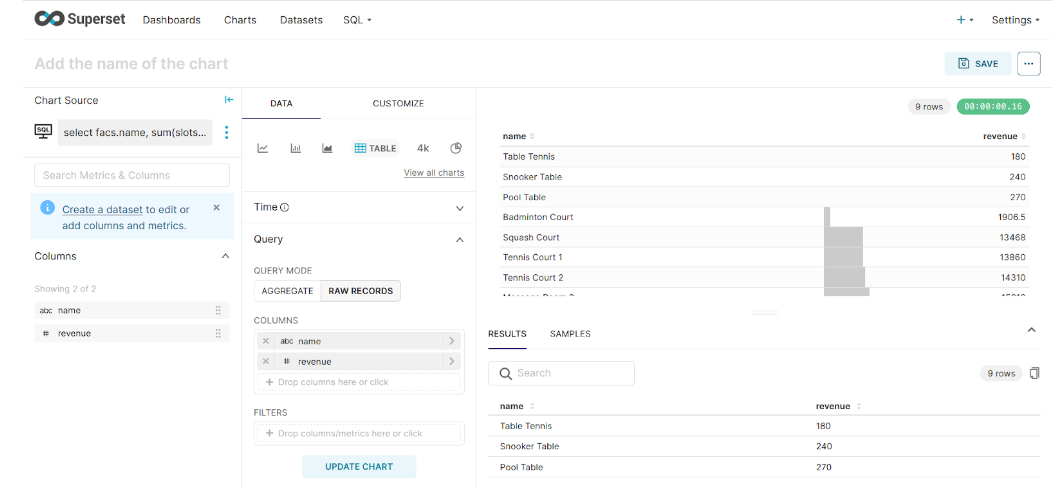
This time, we are going to select a Pie Chart for representation. The requirement is to list the total revenue generated from each facility.
select facs.name, sum(slots * case
when bks.memid = 0 then facs.guestcost
else facs.membercost end) as revenue
from cd.bookings bks
inner join cd.facilities facs
on bks.facid = facs.facid
group by facs.name;
Here, the Dimension field (one or more columns for grouping) will be set to the name, and revenue is the metric for each facility.
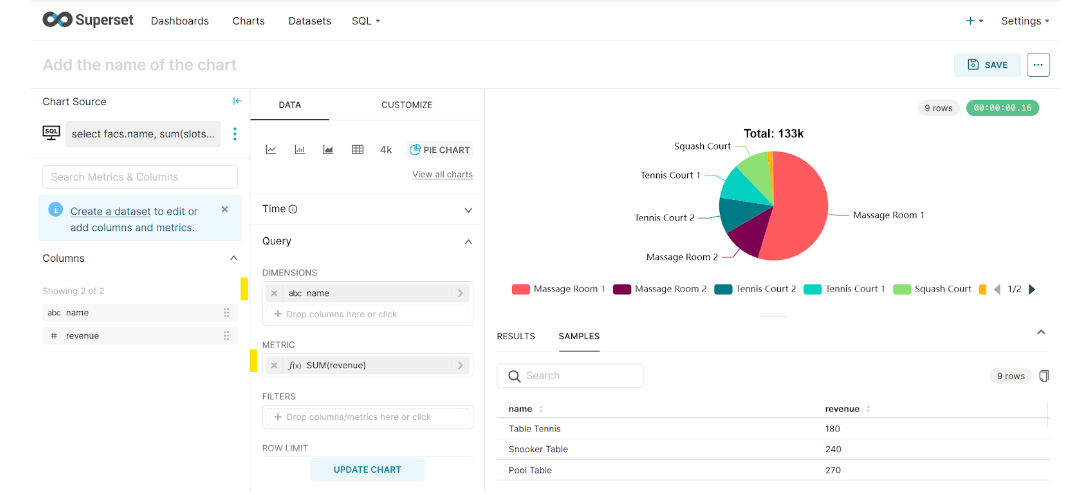
Note: Aggregation is required by Superset even if we have raw data available for queries. The workaround is to do a meaningless aggregation like we did above, i.e., SUM(Revenue). You can learn more about this on Stack Overflow or visit this Apache Superset GitHub page.
Click the Save Chart button, provide details for your query, and save it to the Bookings Dashboard we created earlier.
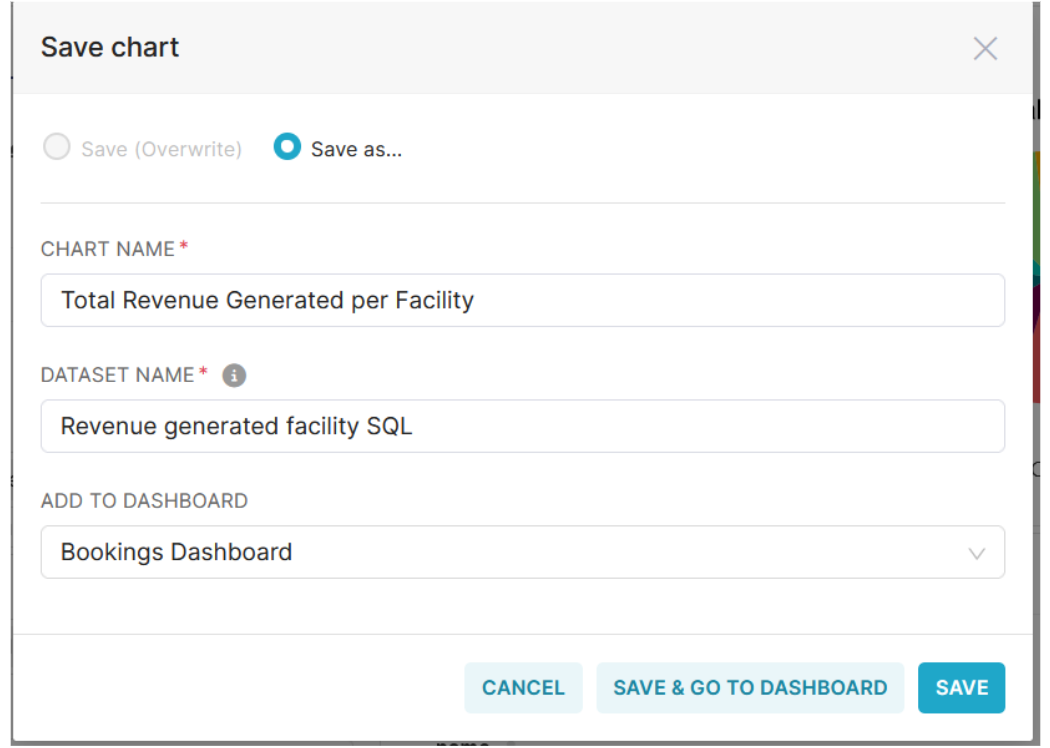
Click on Save & Go To Dashboard.
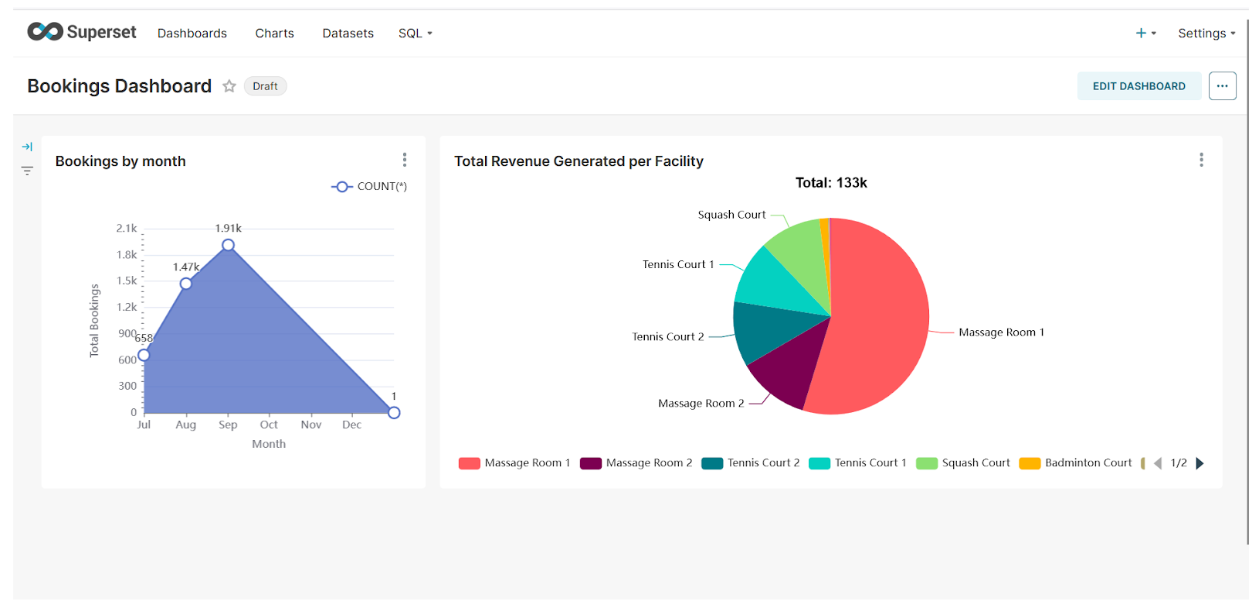
Question: What is the dashboard refresh policy? Users can manually refresh the dashboard or set an auto-refresh interval.
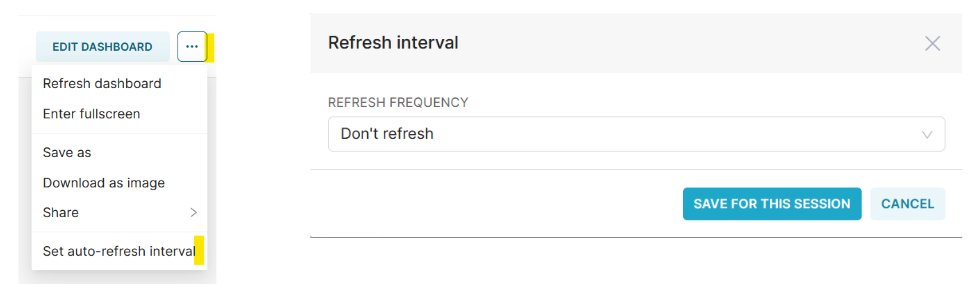
This dashboard can also be shared by clicking on the Share button as it creates a URL to view this dashboard which can be copied to a clipboard or sent by email.
Best Practices for Visualizing Data
- Before starting your visualization, make sure your data is clean and accurate for reliable insights.
- Choose visualization techniques that represent your data's importance, customized for the audience’s interests, and label everything clearly for easy interpretation. Simple is better.
- Using well-optimized SQL queries and indexing can reduce visualization load times for big datasets.
- Consider caching results for frequently accessed visualizations to improve performance.
- Regularly update your dashboards based on user feedback to accommodate new information.
Powering Your Dashboards With Timescale
If you need a database to store your data and power your dashboards, try Timescale, our fast, easy-to-use, and reliable PostgreSQL cloud platform for time series, events, and analytics.
With automatic partitioning, effective data compression (90 percent or more), and real-time data aggregations, Timescale will make your queries lightning-fast, enabling you to build a steady but speedy application that will never let your users down. Want to try it? Create a Timescale account—it’s free for 30 days.
Superset FAQ’s (Important)
What if the table schema changed?
To get Superset to discover your new columns, all you have to do is go to Data -> Datasets, click the edit icon next to the dataset whose schema has changed, and hit Sync columns from source from the Columns tab. Behind the scenes, the new columns will get merged. Following this, you may want to re-edit the table/charts afterward to configure the Columns tab, check the appropriate boxes, and save again.
Can I join/query multiple tables at one time?
Not in the Explore or Visualization UI. A Superset SQLAlchemy data source can only be a single table or a view.
When working with tables, the solution would be to create a table that contains all the fields needed for your analysis, most likely through some scheduled batch process.
A view is a simple logical layer that abstracts arbitrary SQL queries as a virtual table. This can allow you to join and union multiple tables and to apply some transformations using arbitrary SQL expressions. The limitation there is your database performance, as Superset effectively will run a query on top of your query (view). A good practice may be to limit yourself to joining your main large table to one or many small tables only and avoid using GROUP BY where possible, as Superset will do its own GROUP BY, and doing the work twice might slow down performance.
Whether you use a table or a view, performance depends on how fast your database can deliver the result to users interacting with Superset.
However, there is no such limitation if you are using SQL Lab. You can write SQL queries to join multiple tables as long as your database account has access to the tables.