How to Build a Weather Station With Elixir, Nerves, and TimescaleDB
This is an installment of our “Community Member Spotlight” series, where we invite our customers to share their work, shining a light on their success and inspiring others with new ways to use technology to solve problems.
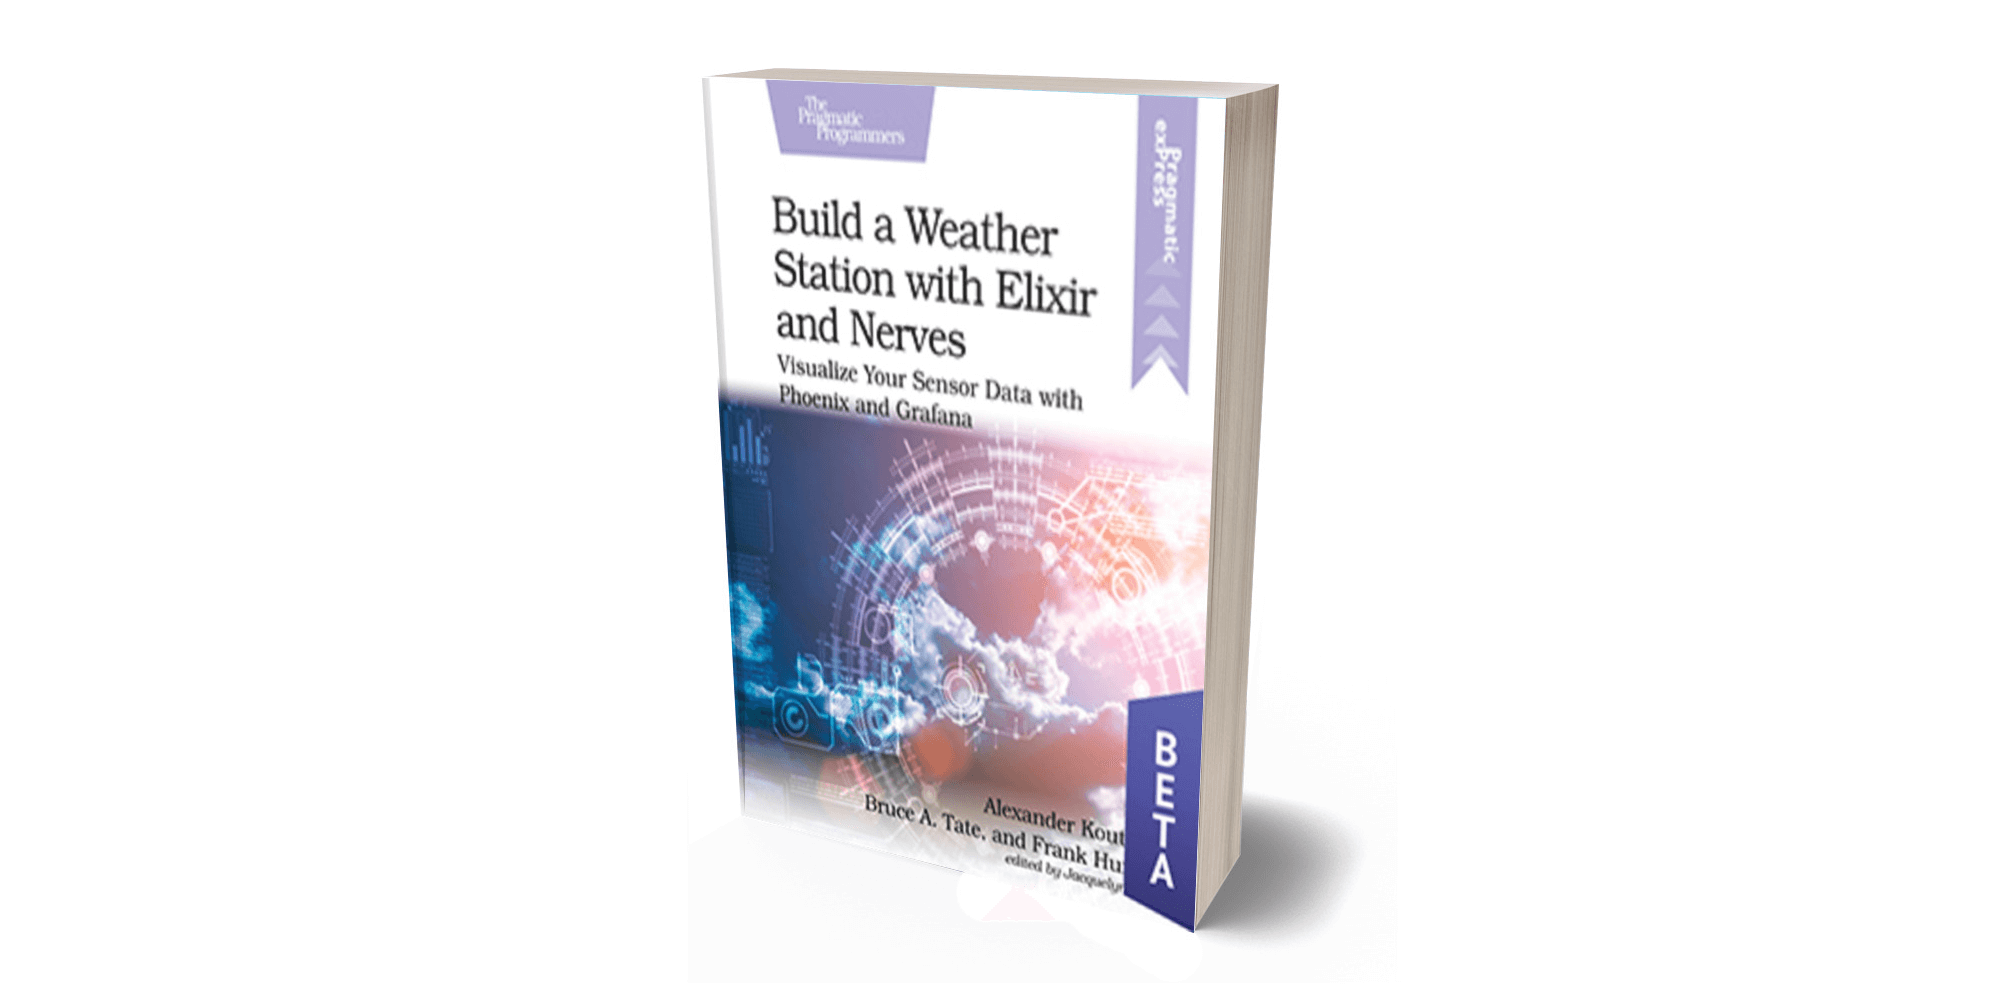
In this edition, Alexander Koutmos, author of the Build a Weather Station with Elixir and Nerves book, joins us to share how he uses Grafana and TimescaleDB to store and visualize weather data collected from IoT sensors.
About the team
The book Build a Weather Station with Elixir and Nerves was a joint effort between Bruce Tate, Frank Hunleth, and me.
I have been writing software professionally for almost a decade and have been working primarily with Elixir since 2016. I currently maintain a few Elixir libraries on Hex and also run Stagira, a software consultancy company.
Bruce Tate is a kayaker, programmer, and father of two from Chattanooga, Tennessee. He is the author of more than ten books and has been around Elixir from the beginning. He is the founder of Groxio, a company that trains Elixir developers.
Frank Hunleth is an embedded systems programmer, OSS maintainer, and Nerves core team member. When not in front of a computer, he loves running and spending time with his family.
About the project
In the Pragmatic Bookshelf book, Build a Weather Station with Elixir and Nerves, we take a project-based approach and guide the reader to create a Nerves-powered IoT weather station.
For those unfamiliar with the Elixir ecosystem, Nerves is an IoT framework that allows you to build and deploy IoT applications on a wide array of embedded devices. At a high level, Nerves allows you to focus on building your project and takes care of a lot of the boilerplate associated with running Elixir on embedded devices.
The goal of the book is to guide the reader through the process of building an end-to-end IoT solution for capturing, persisting, and visualizing weather data.

One of the motivating factors for this book was to create a real-world project where readers could get hands-on experience with hardware without worrying too much about the nitty-gritty of soldering components together. Experimenting with hardware can often feel intimidating and confusing, but with Elixir and Nerves, we feel confident that even beginners get comfortable and productive quickly. As a result, in the book, we leverage a Raspberry Pi Zero W along with a few I2C enabled sensors to capture weather and environmental data. In all, the reader will capture and persist into TimescaleDB the current: altitude, atmospheric pressure, temperature, CO2 levels, TVOC levels, and the ambient light.
Once the environmental data is captured on the Nerves device, it is published to a backend REST API and stored in TimescaleDB for later analytics/visualization. Luckily, TimescaleDB is an extension on top of PostgreSQL, allowing Elixir developers to use existing database tooling like Ecto to interface with time-series enabled tables.
After the time-series weather data is stored in TimescaleDB, we walk the reader through how to visualize this data using the popular open-source visualization tool Grafana. Using Grafana for visualizing the weather was an easy choice given that Grafana natively supports TimescaleDB and is able to easily plot time-series data stored in TimescaleDB hypertables.
✨ Editor’s Note: Check out Grafana 101 video series and Grafana tutorials to learn everything from building awesome, interactive visualizations to setting up custom alerts, sharing dashboards with teammates, and solving common issues.

By the end of the book, readers have a fully-featured IoT application and API backend that can power a live Grafana dashboard in order to plot their TimescaleDB data published from their Nerves weather station.

Choosing (and using!) TimescaleDB
From the onset of the book, we knew that we wanted to use a purpose-built time-series database to persist the weather station data. We wanted the project to be as realistic as possible and something that could possibly be expanded for use in the real world.
With that goal in mind, TimescaleDB was an obvious choice given that PostgreSQL has become a ubiquitous database and it has great support in the Elixir community. In addition, leveraging TimescaleDB on top of PostgreSQL does not add a tremendous amount of overhead or complexity and allows new users to easily leverage the benefits of a time-series database without having to learn any new query languages or databases. Specifically, all it took for readers to start leveraging TimescaleDB was to run a single SQL command in their database migration: SELECT create_hypertable('weather_conditions', 'timestamp').
"It’s this kind of pragmatism and ease of use that makes TimescaleDB a great time-series database for projects both small and large. "
-Alexander Koutmous
All in all, leveraging TimescaleDB as the time-series database for the project worked out great and allowed us to show readers how they can set up a production-ready IoT project in a relatively short amount of time.
✨ Editor’s Note: To start with TimescaleDB today, sign up for a free 30-day trial or install TimescaleDB on your own server.
Getting started advice & resources
Any time we had questions about the inner workings of TimescaleDB, how to set it up, or what the various configuration options are, we turned to the official TimescaleDB docs. Some of the articles that helped us get started included:
• Using TimescaleDB via Docker
• Understanding some of the fundamental TimescaleDB concepts
• Getting an overview of some of the TimescaleDB best practices
We’d like to thank Alex, Bruce, and Frank for sharing their story, as well as for writing a book that makes building full-stack IoT solutions accessible for complete beginners. We congratulate them and the entire Nerves community on their success, and we cannot wait to read the final version of their book that will be released in January 2022 🎊
We’re always keen to feature new community projects and stories on our blog. If you have a story or project you’d like to share, reach out on Slack (@Lucie Šimečková), and we’ll go from there.
Additionally, if you’re looking for more ways to get involved and show your expertise, check out the Timescale Heroes program.